Why Choose a Professional Tableau Course for Your Career?
With more and more information being generated in today’s corporate environment, there is far too much for any team of humans to consume and analyze line by line. Ditch the massive spreadsheets and get to the bottom line with instant answers to critical business questions such as shifting market circumstances, operational hiccups, or even declining sales in a particular region. A comprehensive Tableau training program will show you how to transform raw data into an interactive data story that facilitates immediate organizational insight.
This educational path is tailored to help individuals who are non-technical to analyze data and help organizations make better decisions with the help of data. There are a number of methodologies on how to create visualizations, and by mastering these methods, you can convert data into an organizational asset. Such a program will help individuals who are looking to make a career transition to corporate analytics as well as individuals who are already working in a department and want to improve their work efficiency. Today, in the competitive hiring landscape of India, having such a skill set is favored by hiring managers across industries.
- Enable Decision Makers: Help corporate databases translate into measurable information.
- Easy to Learn: Since it’s based on a clean drag-and-drop functionality, there is no need to have prior knowledge of coding or programming.
- Cross-Industry Versatility: Our data-visualization program empowers you to apply your newly acquired skill to industries like corporate finance, human resources, digital marketing, and logistics.
- Strategic Career Upgrade: If you currently are doing data entry or similar work and want to transition to a higher-level job of generating reports for the top executives of a company and helping in business planning, then this is what you can achieve through learning Tableau.
What Specific Skills Will You Master in This Tableau Training?
Our Tableau training curriculum is structured to go from starting from square one with data and move all the way to building out a production architecture. We start with students learning how to properly add our data sources, linking to local spreadsheets, cloud data servers, or relational databases. For the beginners, we first teach them the automated diagnostic tools within Tableau, like the Data Interpreter. Students will be able to clean the data records using the Data Interpreter tool before even making their first chart. They will be able to strip down fields that are not needed and deal with tables of vastly different sizes. As they become more familiar with connecting to and using the data with Tableau, we will progress to topics such as creating relationships, data blending, and even cross-database joins.
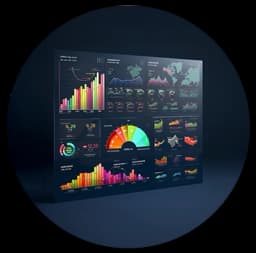
Going beyond simple bar and pie charts, the core modules cover more than 25 different types of visualizations. These include simple trend lines; dual-axis charts; maps of all geographic scopes; and heat maps. Most importantly, you will learn to create interactive analyses by employing dynamic calculations, parameters, and even complex Level of Detail (LOD) expressions. In the end, the practical parts of the curriculum are designed to prepare you for creating clean and organized analysis ecosystems consisting of several independent worksheets.
- Advanced Data Preparation: Connect to all file types (csv, xls, json, sql, etc.) - automated data blending - work with metadata.
- Interactive Analytics Core: Learn to create custom calculated fields, table calculations, and logical filters to give users of your reports and dashboards greater analytical ability.
- Geographic and Trend Mapping: How to map the performance of your company worldwide and spot trends and seasonal changes in your data with graphical precision.
- Dashboard Architecture Design: Learn to organize your worksheets into a clean, cohesive analysis in a few well-organized worksheets.
How Do Our Practical Tableau Classes Prepare You for the Real World?
The primary advantage of our industry-aligned Tableau classes is our outright rejection of teaching data concepts from within the confines of rigid textbook lecturing. Data concepts get embedded more effectively into the minds of working professionals when the case assignments resemble what they have to do on their daily jobs. In our hands-on lab sessions, we use real operational assets such as retail sales data, customer service ticketing logs, website performance tracking data, etc. and also work with realistic and operational HR data such as payroll distributions.
Our classes are very interactive; our students receive a lot of 1-on-1 time with their teacher and work on individual capstone projects where students design, build out, and deliver a portfolio-quality end-to-end dashboard from start to finish (ingest the data, clean it all up, create all visuals, etc.). We review all of their work one at a time with in-depth feedback on the particular dashboard that they built. In terms of the number of students in our classes, we keep them intentionally very small, so our certified instructors can give students individualized attention as each student goes through their unique learning process.
- Hands-On With Industry-Driven Case Studies: Work with data from real-life scenarios of retail, digital agencies, financial services, and more.
- Micro-Class Environment: Our “micro-classes” are set up to allow for small group learning, screen sharing, independent work, and questions on the fly in a format that is completely customizable to meet the needs of each student.
- Portfolio-Ready Projects: Complete a fully functional end-to-end dashboard for each client assigned in a course and add all work completed to their portfolio to use for future job applications.
- Comfortable with Messy Data: You will learn to use the Data Reflector to find errors within your data, merge large tables of data from completely separate databases, and repair split corporate data into a number of sheets to name but a few.
Can you master data analytics through our online Tableau course?
Don’t let your professional responsibilities / academic schedule get in the way of upgrading your skills. Our Online Tableau Course (Premium) delivers exactly the same depth and intensity of learning as our Classroom Program, from the comfort of your home. What you won’t get in our online program are pre-recorded video modules. Instead, you get to participate in a live class where you can ask questions, collaborate on a dashboard, and even get your code fixed instantly for issues that need troubleshooting.
All our Online sessions are held in a virtual learning environment, where you can share your screen, get answers to your questions on using calculated fields, troubleshoot any bugs in your dashboard, particularly those related to data joining, etc. Also, all our live sessions are recorded and uploaded in the learning management repository of our online portal so that you can log in and access them anytime, anywhere. You would be distributed the same set of real-world retail, HR, and corporate financial data sheets as that of a physical classroom, thereby creating a powerful simulation of a retail/HR/campus analytics laboratory on your desktop.
- Synchronous Live Classrooms: Learn to create visualizations in synchronous live classrooms with the same interaction and ability to voice your doubts. Collaborate with fellow students and get code troubleshooting help immediately.
- Session Archives: We record every live session in HD and upload it to the learner’s account in our learning management portal. So, if a learner misses a day of classes due to work emergencies, they can catch up on the archived session any time they want.
- Digital Project Repositories: Access a huge online cloud repository filled with all sorts of uneven data in tables, customer logs and more to practice on.
- Virtual Portfolio Review: You can showcase your growing cloud-based dashboards to your mentors during your 1-on-1 sessions with them, including screen sharing of your application.
- Remote Job Placement Drive: In addition to virtual recruitment sessions, our students benefit from our remote job placement drives, digital resume-building sessions, and mock technical interviews for jobs that can be done remotely all across the globe.
Do we offer customized Tableau training for corporate teams?
Most organizations have different levels of data maturity between departments, and hence the generic corporate seminars are rarely successful in bringing about lasting changes within organizations. SevenMentor's Tableau training program for corporate teams is designed within the confines of an organization’s unique reporting ecosystem. Our trainers conduct a comprehensive assessment of an organization’s reporting barriers prior to conducting any classroom sessions or live online sessions. For example, an organization’s finance team would benefit from reducing the number of hours spent in compiling the weekly cash flow statements, whereas the digital marketing wing would benefit from creating cleaner customer acquisition funnels using advanced analytics. We teach our participants to apply their newly acquired skills immediately in their workplace the next day.
Whether it is to help the finance department to reduce the time to create a weekly cash flow statement or to help the digital marketing team to create a cleaner customer acquisition funnel, we at SevenMentor do not use the classroom files that we have used in classroom training sessions. Instead, we map the reports and data that the team uses to create files (real or simulated) that they use on a day-to-day basis to apply the advanced analytics techniques to perform tasks efficiently the next day.
- Customized Enterprise Syllabus: We create a customized learning plan for your organization around the specific data connections, APIs, reports, and reporting cadence that your business uses.
- Flexible Operational Delivery: We can deliver intensive on-site corporate workshops from your office or hold live, interactive, and collaborative training sessions from multiple locations around the world via live streams.
- Direct Workflow Optimization: We can help transform the work of your legacy business teams from using slow, manual Excel macros to develop management reports to immediate, interactive management displays in real time.
- Cross-Department Usability: Our approach enables every department, including Human Resources, Operations, and core sales divisions, to leverage the power of data to make quick and informed business decisions.
- After workshop hours – Dedicated post workshop trouble shooting sessions are arranged to get your in house developers to deploy the newly created interactive dashboards into the production servers.
What career opportunities unlock after earning a Tableau certification?
Having completed all the practical training modules, you will now have to proceed to the stage of becoming super professional, i.e., achieving a recognized Tableau certification from a reputed institute like SevenMentor makes you more data proficient & gets recognized by hiring managers from across the globe & technical recruiters worldwide. They look for problem solvers who can provide solutions by interpreting data at hand and not just theory taught in classrooms. Also, a candidate with a fully developed portfolio of interactive dashboards created by the candidate during the training would be looked upon favorably by any employer.
Whatever your current skill level with numbers, the certification program proves that you can transform masses of data from your server into organized, strategic facts and figures. If you are newly graduating or entering the job market for the first time and are looking for the best-paying corporation for you, then this is the best place to start. If, on the other hand, you are already working within MIS as an analyst or in other similar roles, then this certification program will provide you with the tools that you need to climb the corporate ladder.
- Diverse Job Architecture: Qualify immediately for premium corporate positions such as Data Storyteller, Business Intelligence Analyst, Analytics Consultant, or MIS Executive.
- Huge Raise in Pay: After finishing the Tableau certification course, you’ll qualify as an analyst, and you'll definitely get paid more than those who can only work with spreadsheets.
- Global Edge for Recruitment: Get yourself certified in an internationally acceptable skill set and benchmark portfolio for the most sought-after job opportunities in technology zones across the globe.
- Executive Visibility Boost: Develop visualizations that your senior management can rely on on a weekly basis and look like a strategic asset at your company.
- Long-Term Career Growth: SevenMentor’s Tableau Certification will future-proof your career as all companies will move towards automation of data with a dashboard-based business environment in the long run.
How does SevenMentor ensure a risk-free learning experience for every student?
We have a student feedback system in place across the industry. Our Tableau course thus helps to avoid the typical problems that one encounters at the various training centers. The most important aspect of education, thus, is transparent education or education that protects your time, money and career.
At Zimo, from the day you join a program, you are covered by a number of concrete operational guarantees. These will ensure that you do not have to suffer from variations in teaching quality, unexpected administrative changes, or very aggressive or unfair placement practices. The aim of our education program is not to merely teach students data analytics.
- Best Faculty: No chance of a very average professor. Our super-experienced senior data architects have been shortlisted & selected based on strict corporate interview rounds and have been cleared by corporate hiring managers to teach in the classroom.
- 100% Zero Hidden Placement Fees: We do not charge any additional fees after a candidate's selection. All our students receive the best career assistance as part of their learning package, and there are no hidden processing fees.
- Verified Job Description: Many job postings today mislead students. We have a team that verifies the job descriptions to make sure our students get placed in genuine business intelligence, MIS, or data analytics roles that match their skill levels.
- Flexible Placement Autonomy: We respect students’ career objectives. If a company posts modifications in a compensation package or job responsibilities post-interviews, students can decline such an offer and still get access to attend other interviews for placements.
- Guaranteed Batch Schedule: We guarantee that your class will happen on time. We guarantee that the maximum number of students in your class will be capped. We guarantee that your offline classes will not be abruptly switched to online classes at the last minute.
How does our Tableau Training integrate with broader corporate tech domains?
There is no such thing as a ‘standalone’ organization, they exist within an ecosystem of other businesses and technologies within the broader enterprise technology stack. As such, Tableau Course by SevenMentor seamlessly integrates with leading-edge enterprise technologies such as other data visualization, business intelligence, and analytics tools and platforms as well as leading big data, data science, database, programming, cloud, cybersecurity, development, and project management tools & software. Learn to build interactive dashboards and visual reports to pull data from across your enterprise technology stack to become the ideal candidate for top data-driven organizations across the globe.
Whether you need to pull data from database tracking of your web servers in real time, visualize your company’s logistics or use predictive intelligence within your executive summaries, we can train you on all the tools you need to become the ideal candidate for leading global companies in today’s interconnected corporate environments.
- Data Science & Data Analytics: Leverage advanced data science methodologies to build data-driven web applications and business insights in conjunction with targeted data analytics to drive key performance indicators and user behavior measurement for your information systems.
- Python & Java Engineering: If you have been learning to source your visualizations from a web application, we also teach how to implement the backend development for your web applications using very popular languages like Python and also using Java for enterprise development.
- Cloud Computing & DevOps: Students can learn how to fetch data from live data streams hosted on cloud computing platforms and also learn to work with DevOps tools and methods for continuous integration and continuous deployment.
- Cyber Security & SAP Infrastructure: Lock down your data with cybersecurity methods and tools for securing web applications and then connect to SAP systems to build enterprise-level solutions and dashboards that fetch data to present to end users.
- Generative AI & ChatGPT Integration: In our courses on data science and analytics, you can learn to build intelligent applications with Generative AI & AI courses and also learn to integrate AI-powered chatbots in your applications with our ChatGPT courses.
- Power BI & Salesforce CRM Platforms: Learn how to develop visualizations and reports on top of Power BI dashboards and customer-focused business applications on top of Salesforce CRM Platforms for web solutions
Got Questions? Here Are Some FAQs
Q1. What is a Tableau course?
A Tableau course is used to teach students how to create interactive dashboards, data visualization and business reports using Tableau. The classes are designed for beginners as well as for more experienced individuals and teach practical data analysis.
Q2. Who should enroll in a Tableau course?
Tableau courses are for students, working professionals, business analysts, data analysts, IT professionals, and anyone else interested in learning to create interactive dashboards and reports that can be used by others to make better business decisions using data visualization and business intelligence.
Q3. Do I need programming knowledge to learn Tableau?
No, programming knowledge is not required to start learning Tableau. Tableau is designed to be very user-friendly and is a drag-and-drop type of tool for creating interactive reports and dashboards.
Q4. What career opportunities are available after completing a Tableau course?
Some of the career opportunities available for the students who have completed the course in Tableau are Tableau Developer, Data Analyst, Business Intelligence Analyst, Reporting Analyst, and many other jobs related to data visualization and business intelligence.
Q5. How long does it take to complete a Tableau course?
The duration of the majority of Tableau courses will vary depending on the style of course and how quickly the student is able to work through the course materials; on average, students complete a Tableau course within 4 to 8 weeks. As part of completing your course, you will be assigned a number of practical projects to complete, which will allow you to get hands-on experience with Tableau whilst working through the course.
Anthropic AI Tool
What is Writesonic
What is Claude AI
AI Engineer Roadmap
What is JasperAI
What is Copy AI
Do visit our channel to know more: SevenMentor
 Tableau is a visual analytics tool for analysing data and solving problems.
 Used by businesses in marketing, sales, and customer satisfaction.
 Tableau is easy to understand and does not require specific training or coding knowledge.